Empowering Decisions: Your Guide to Real-Time Data Visualization Dashboards
In today’s fast-paced digital landscape, data is more than just numbers; it’s the lifeblood of informed decision-making. Businesses that harness the power of their data in real-time gain an unparalleled competitive edge. At Doterb, we understand that transforming raw data into actionable insights is crucial for innovation and growth. This article explores the vital role of real-time data visualization dashboards and how Doterb empowers organizations to build these powerful tools.
Table of Contents
- Why Real-Time Data Visualization is Crucial for Modern Businesses
- Key Components of an Effective Real-Time Dashboard
- The Doterb Approach to Building Your Dashboard
- Real-World Applications and Benefits
- Frequently Asked Questions
Why Real-Time Data Visualization is Crucial for Modern Businesses
The sheer volume of data generated daily can be overwhelming. From customer interactions and sales figures to operational metrics and website traffic, businesses are swimming in information. The challenge isn’t merely collecting data; it’s making sense of it quickly enough to react and adapt effectively.
The Data Deluge and Decision-Making
Traditional reporting methods often present data retrospectively, providing insights into what has happened. While valuable, this historical view can lead to delayed responses in dynamic markets. Real-time data visualization, conversely, offers an immediate pulse on your operations, allowing for proactive adjustments rather than reactive measures.
Bridging the Gap: From Raw Data to Actionable Insights
A well-designed real-time dashboard transforms complex datasets into intuitive, visual representations. This enables stakeholders, from executives to operational teams, to grasp critical information at a glance, identify trends, spot anomalies, and make data-driven decisions swiftly. As the world continuously evolves, so too must our strategies for staying ahead. Indeed, “Digital transformation is not an option, it’s a necessity to stay relevant.” Leveraging real-time data visualization is a cornerstone of this essential transformation.
Key Components of an Effective Real-Time Dashboard
Building a robust real-time data visualization dashboard requires careful consideration of several interconnected components:
Data Collection & Integration
The foundation of any real-time dashboard is its ability to pull data from diverse sources simultaneously. This involves integrating with various systems like CRM, ERP, marketing platforms, IoT devices, databases, and more. APIs, data connectors, and message brokers are crucial for seamless, continuous data streams.
Data Processing & Storage
Once collected, raw data needs to be processed, cleansed, and often transformed into a usable format. This often involves stream processing technologies that can handle high volumes of data with low latency. Efficient, scalable databases (e.g., NoSQL, in-memory databases) are essential for storing and querying this rapidly changing information.
Visualization & User Interface (UI)
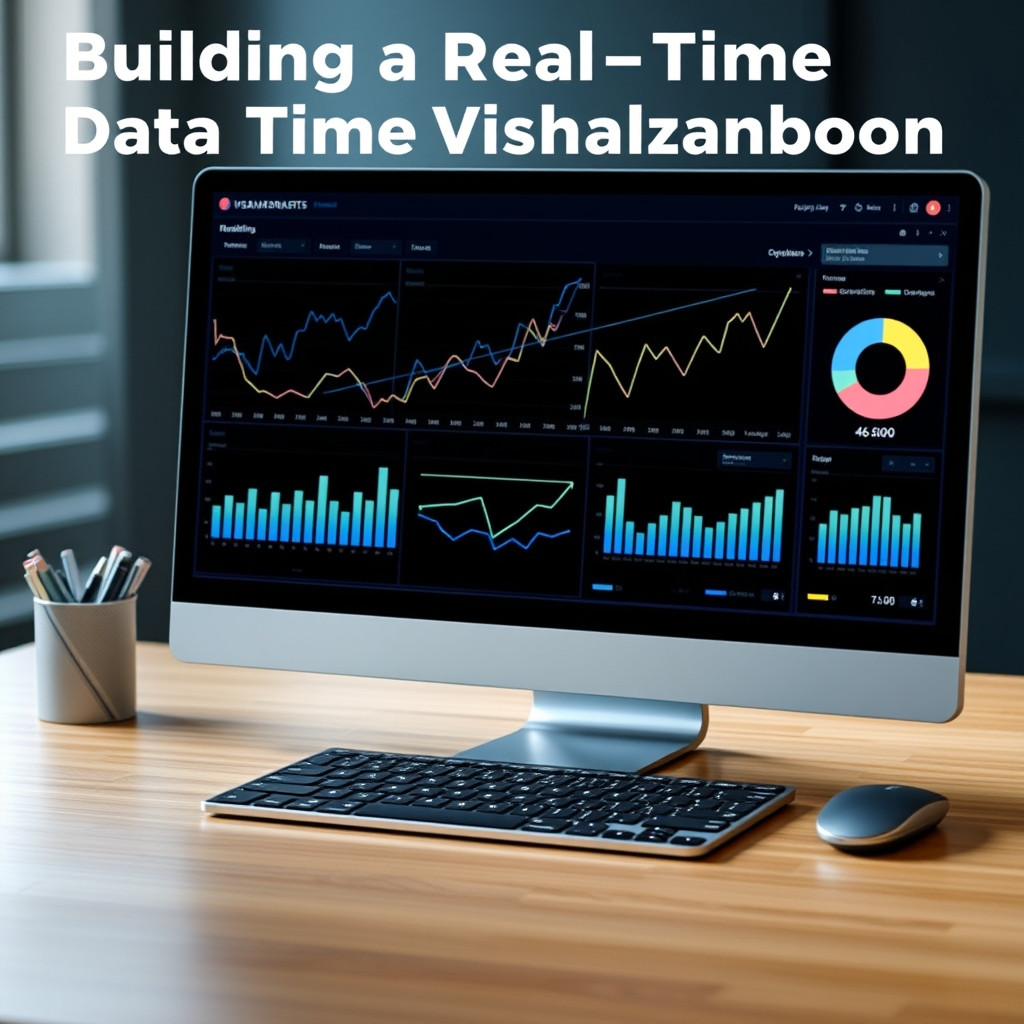
This is where the magic happens – transforming processed data into compelling visual elements like charts, graphs, maps, and gauges. The UI must be intuitive, customizable, and responsive, allowing users to drill down into details, filter information, and personalize their view without extensive training.
Scalability & Security
A real-time dashboard must be built to scale, accommodating increasing data volumes and user loads without compromising performance. Furthermore, robust security measures, including data encryption, access controls, and compliance adherence, are paramount to protect sensitive business information.
The Doterb Approach to Building Your Dashboard
At Doterb, we follow a structured, client-centric methodology to ensure your real-time data visualization dashboard not only meets but exceeds your business objectives.
Discovery & Strategy: Understanding Your Needs
Every great solution starts with a deep understanding of the problem. We collaborate closely with your team to identify key performance indicators (KPIs), critical data sources, user requirements, and desired outcomes. This foundational phase ensures the dashboard aligns perfectly with your strategic goals.
Technology Stack Selection: Tailored for Performance
Leveraging our expertise in web development and system integration, we recommend and implement the most appropriate technologies for your specific needs. This might include cutting-edge visualization libraries (e.g., D3.js, Chart.js), robust backend frameworks, cloud infrastructure (AWS, Azure, GCP), and specialized real-time data platforms.
Agile Development & Iteration
Our agile development process ensures flexibility and transparency. We build your dashboard in iterative sprints, incorporating your feedback at each stage. This iterative approach allows for continuous refinement and ensures the final product is highly functional and user-friendly.
Deployment & Ongoing Support
Once developed, we manage the seamless deployment of your dashboard. Our service doesn’t end there; Doterb provides ongoing maintenance, performance monitoring, security updates, and feature enhancements to ensure your dashboard remains a powerful, reliable asset for your business.
Real-World Applications and Benefits
The applications of real-time data visualization are vast and impactful across various industries:
Enhanced Operational Efficiency
- Monitor manufacturing lines for anomalies and predict maintenance needs.
- Track logistics and supply chain movements to optimize routes and reduce delays.
- Oversee IT infrastructure performance to prevent outages.
Improved Customer Experience
- Analyze website traffic and user behavior in real-time to optimize conversion funnels.
- Track customer service interactions and sentiment to improve support quality.
- Personalize marketing campaigns based on immediate user actions.
Proactive Risk Management
- Detect fraudulent transactions as they occur.
- Monitor financial market fluctuations for immediate trading decisions.
- Track cybersecurity threats and network intrusions.
Strategic Business Growth
- Identify emerging market trends and competitive shifts.
- Evaluate the real-time impact of new product launches or marketing initiatives.
- Optimize resource allocation based on current demand.
Frequently Asked Questions
Q1: What kind of data can be visualized in a real-time dashboard?
A1: Nearly any type of business data can be integrated and visualized in real-time. This includes sales performance, marketing campaign effectiveness, website analytics, IoT sensor data, financial transactions, operational metrics, customer support queues, social media engagement, and much more. The key is identifying the data sources crucial for your specific business decisions.
Q2: How long does it typically take to build a real-time data visualization dashboard?
A2: The timeline for building a real-time dashboard varies significantly depending on its complexity, the number of data sources, the sophistication of integrations, and the desired features. Simple dashboards with existing data infrastructure might take a few weeks, while complex enterprise-level solutions with multiple integrations and advanced analytics could take several months. Doterb’s agile approach ensures efficient development cycles with regular progress updates.
Q3: Is real-time data visualization only beneficial for large enterprises?
A3: Absolutely not. While large enterprises certainly benefit, businesses of all sizes can leverage real-time data visualization. Small to medium-sized businesses (SMBs) can use it to monitor sales trends, optimize marketing spend, or manage inventory more effectively, often gaining a significant competitive advantage over those relying on outdated reporting. Doterb designs scalable solutions that fit your organization’s specific needs and budget.
In a world where speed and insight dictate success, a real-time data visualization dashboard is no longer a luxury but a strategic imperative. It empowers your business to move beyond guesswork, making informed decisions that drive efficiency, enhance customer experiences, and foster sustainable growth. If your organization is ready to unlock the full potential of its data and embark on a transformative journey, the Doterb team is here to help. We combine expert web development, seamless system integration, and a deep understanding of digital transformation to build solutions that propel your business forward. Contact Doterb today to discuss your vision and discover how we can create a real-time data visualization dashboard tailored precisely to your needs.